Social media growth is not standing still, and neither is the way people buy it. To see where our customers' buying is heading, we analyzed more than one million anonymized orders placed on Boostero between January 2025 and June 2026. The picture that emerged is clear: short-form video is pulling away, our customers are putting more of their orders into engagement services such as shares, saves and comments, and the geographically identified orders came from more than 25 countries. Here is what 18 months of data tells us about the state of social media growth in 2026.
Instagram and TikTok Are Pulling Away
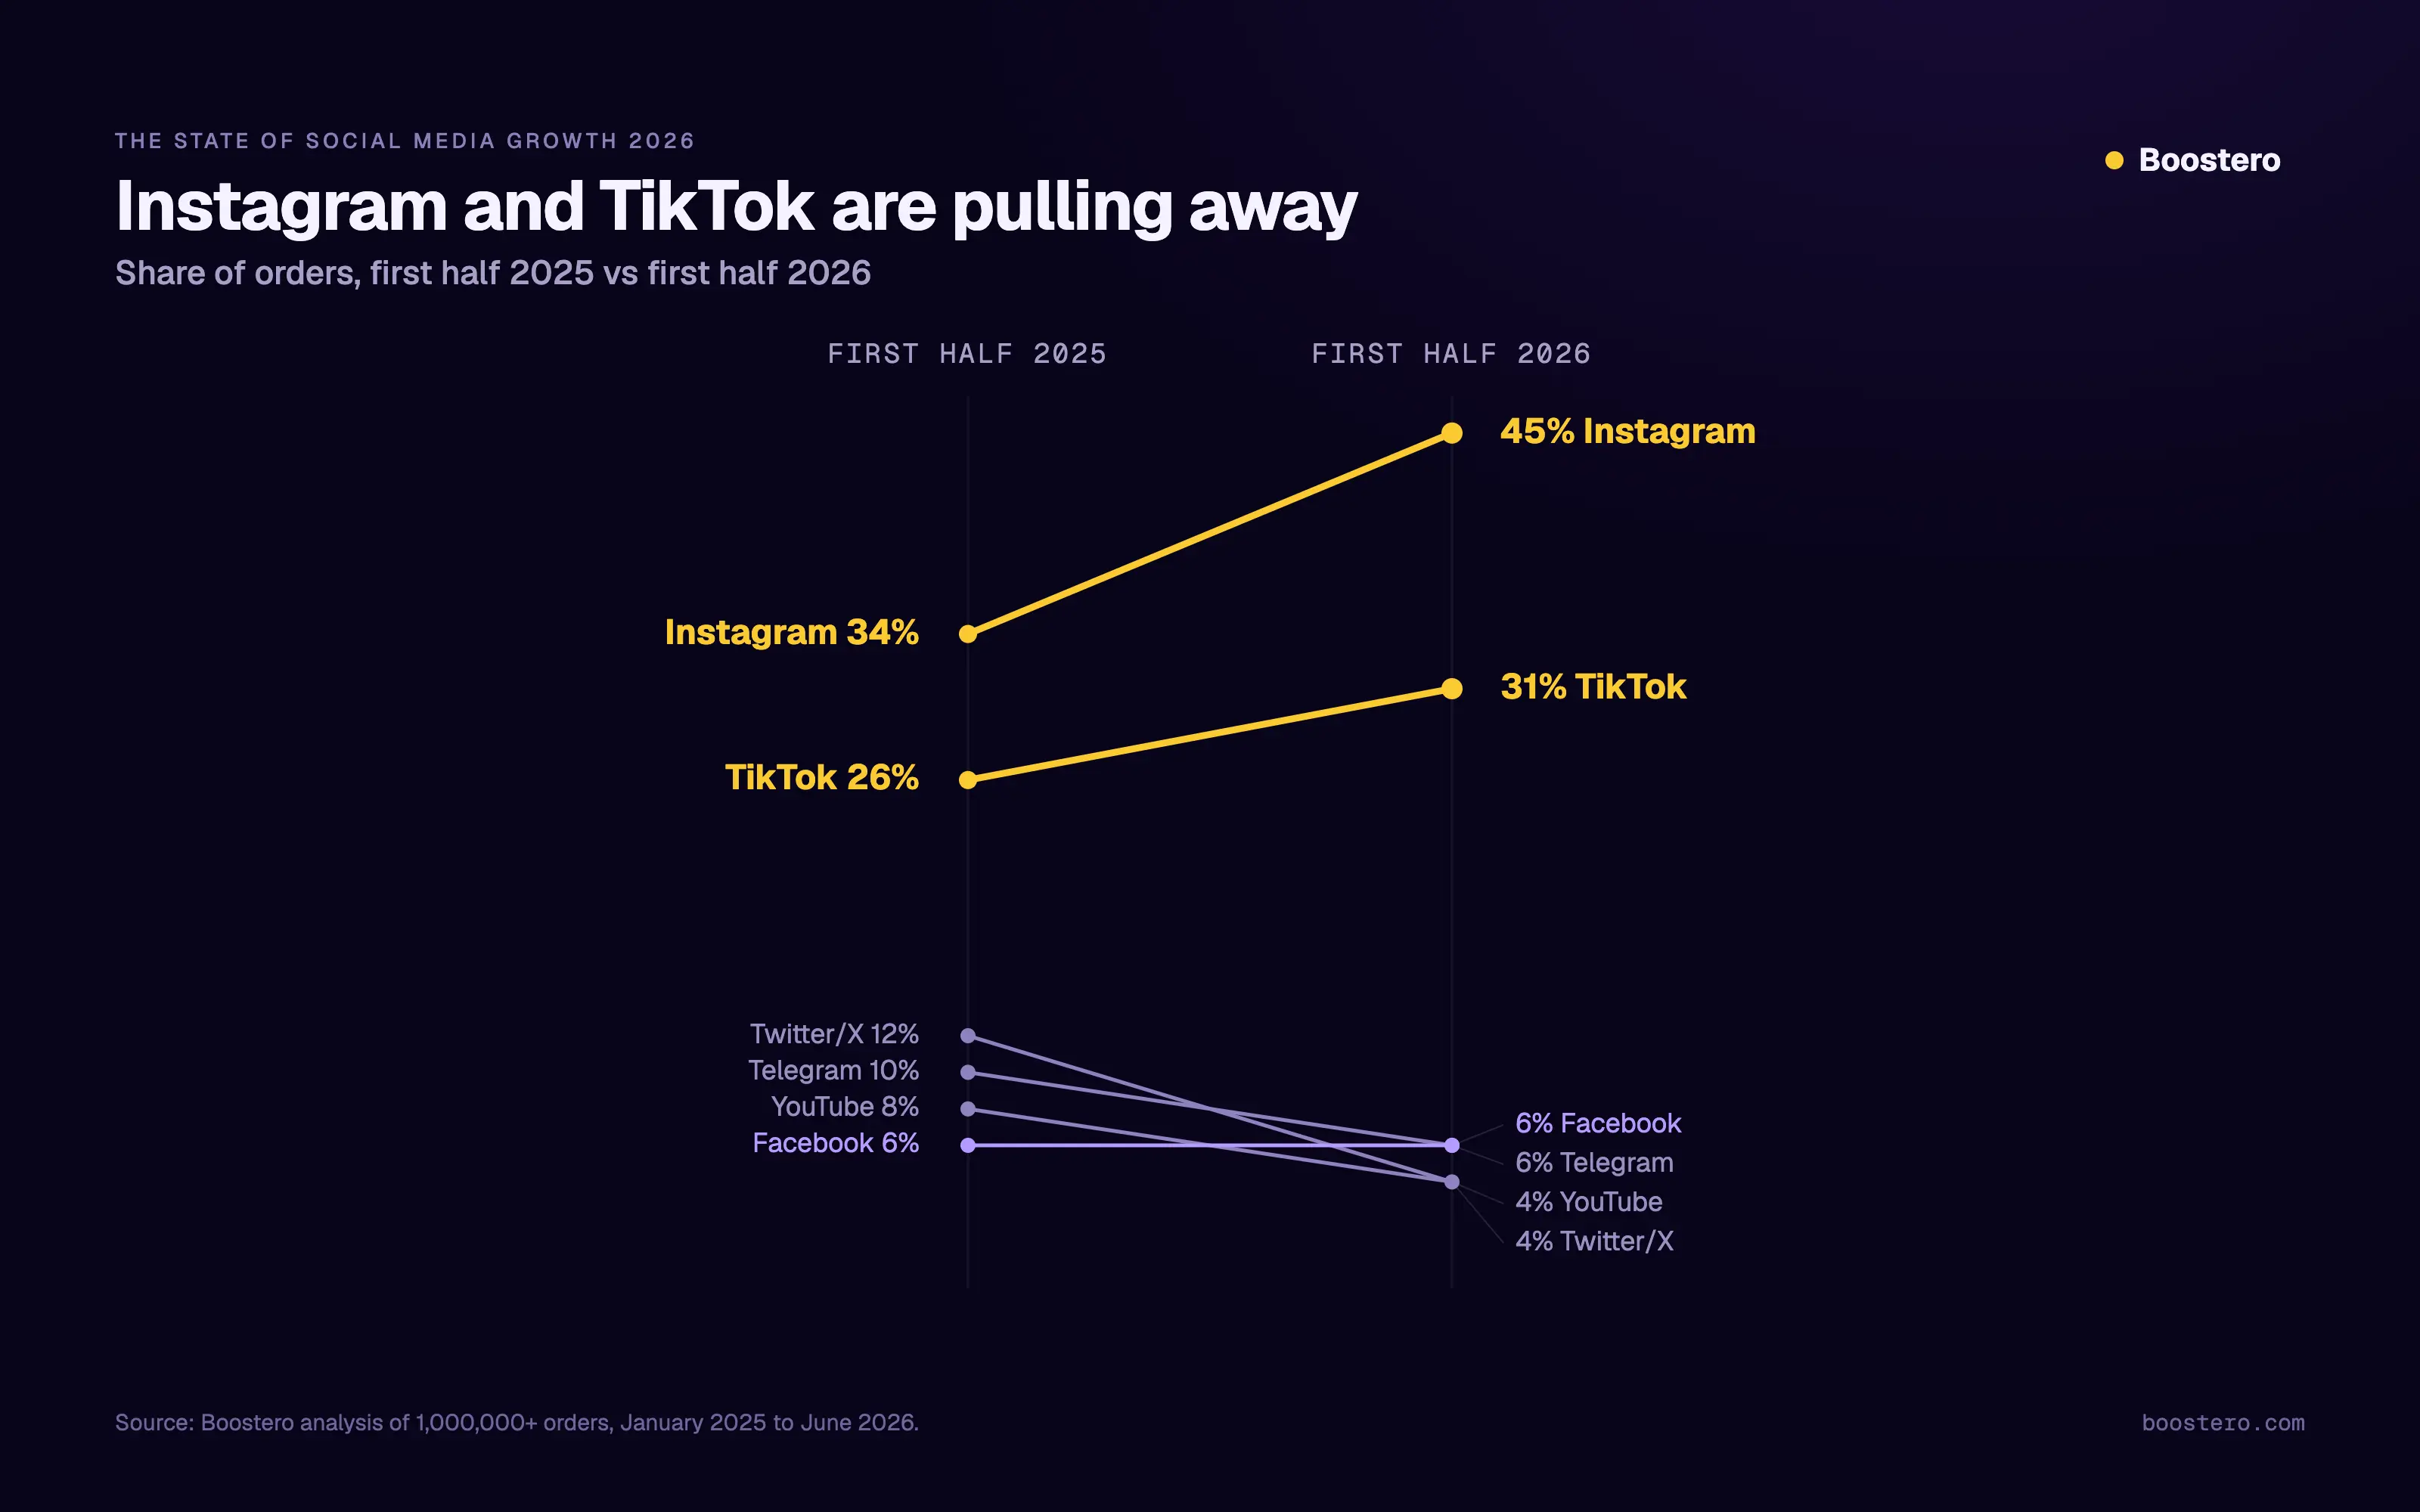
Share of orders by platform, first half of 2025 against first half of 2026. Behind the two leaders, Twitter/X fell from 12 percent to 4, Telegram from 10 to 6, and YouTube from 8 to 4.
In the first half of 2026, two platforms took most of our orders. Instagram grew its share of all orders from 34 percent in the first half of 2025 to 45 percent in the first half of 2026, while TikTok climbed from 26 percent to 31 percent. Together, the two short-form-first platforms account for roughly three out of every four orders.
The rest of the field moved the other way. Twitter/X, Telegram, YouTube, and Facebook each slipped in relative share as attention concentrated on the two leaders. This does not mean the other networks are shrinking in absolute terms, but it does show where our customers put most of their orders: Instagram and TikTok.
Engagement Services Gained Share of Orders
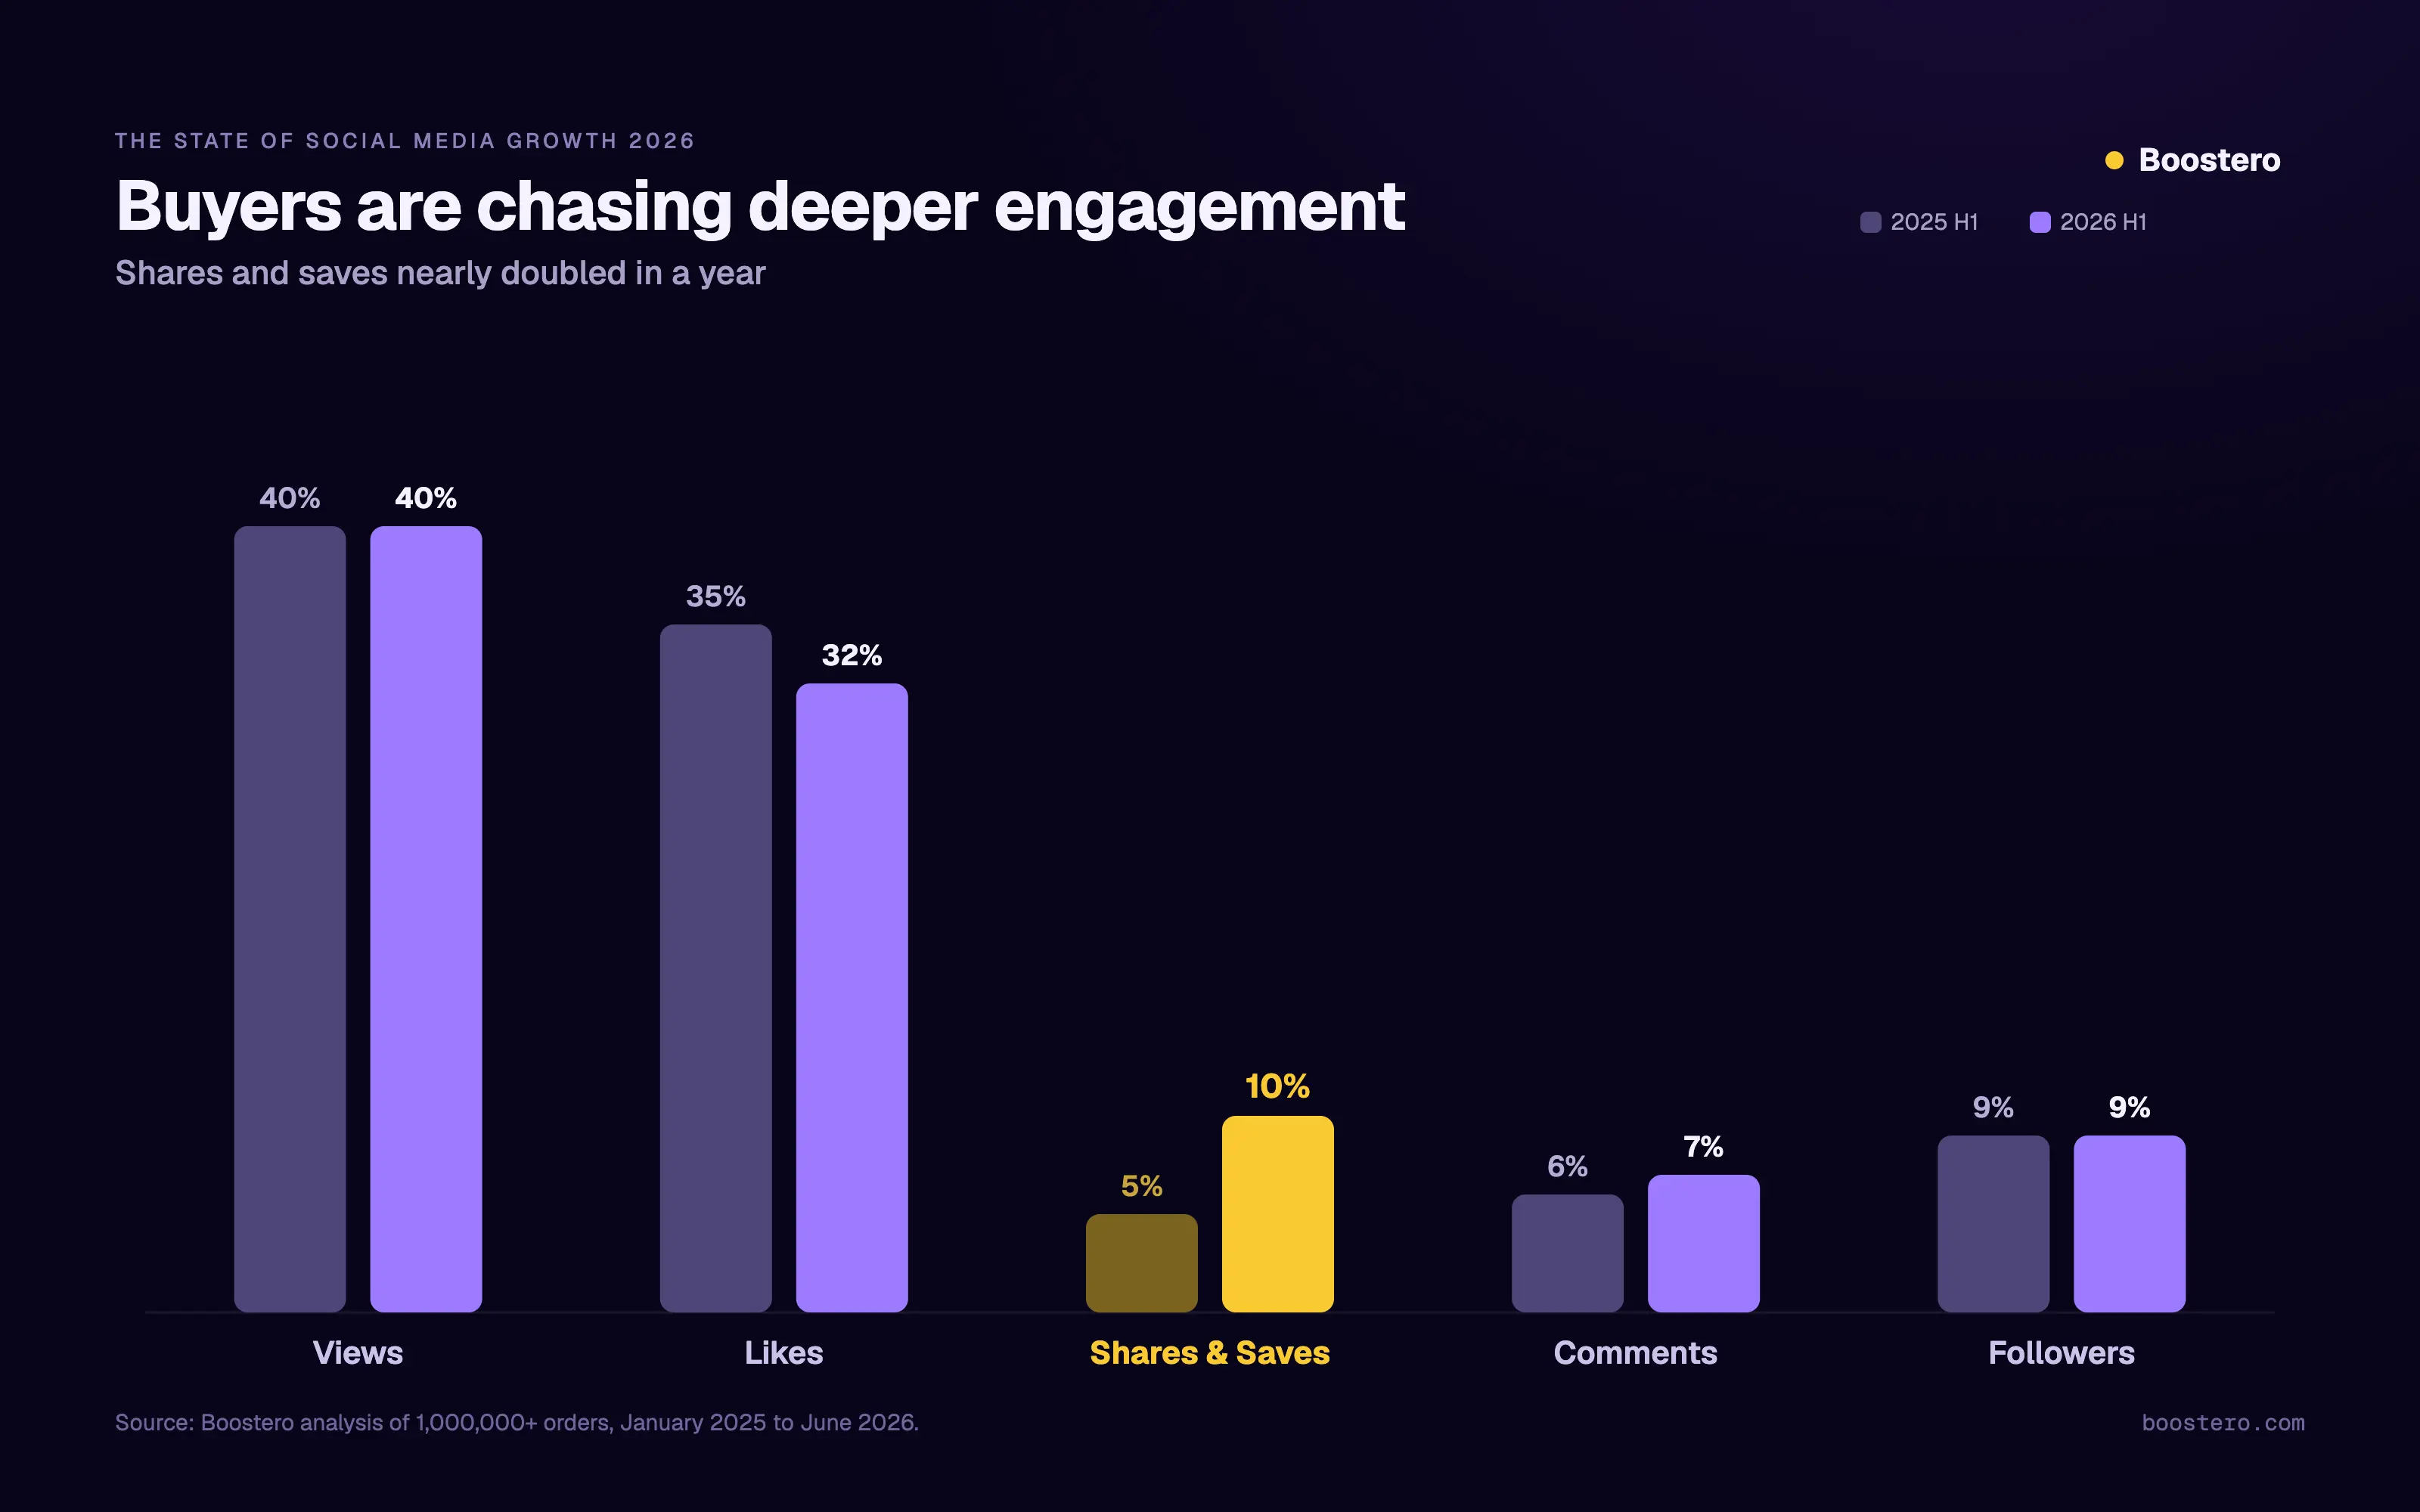
Change in service mix between the first halves of 2025 and 2026. Orders for Shares and Saves doubled their share from 5 percent to 10 percent, while Comments also grew.
The service mix tells an even more interesting story. Views were the most ordered service at 42 percent of all orders, followed by Likes at 32 percent. Followers made up just 9 percent.
The clearest shift was in deeper engagement. Orders for Shares and Saves doubled their share, from 5 percent to 10 percent, between the first halves of 2025 and 2026, and Comments also rose. The pattern shows our customers moving part of their orders to engagement services such as shares and saves; the order data does not show why, and what a platform does with any of it is its own call.
Every Platform Has Its Own Pattern
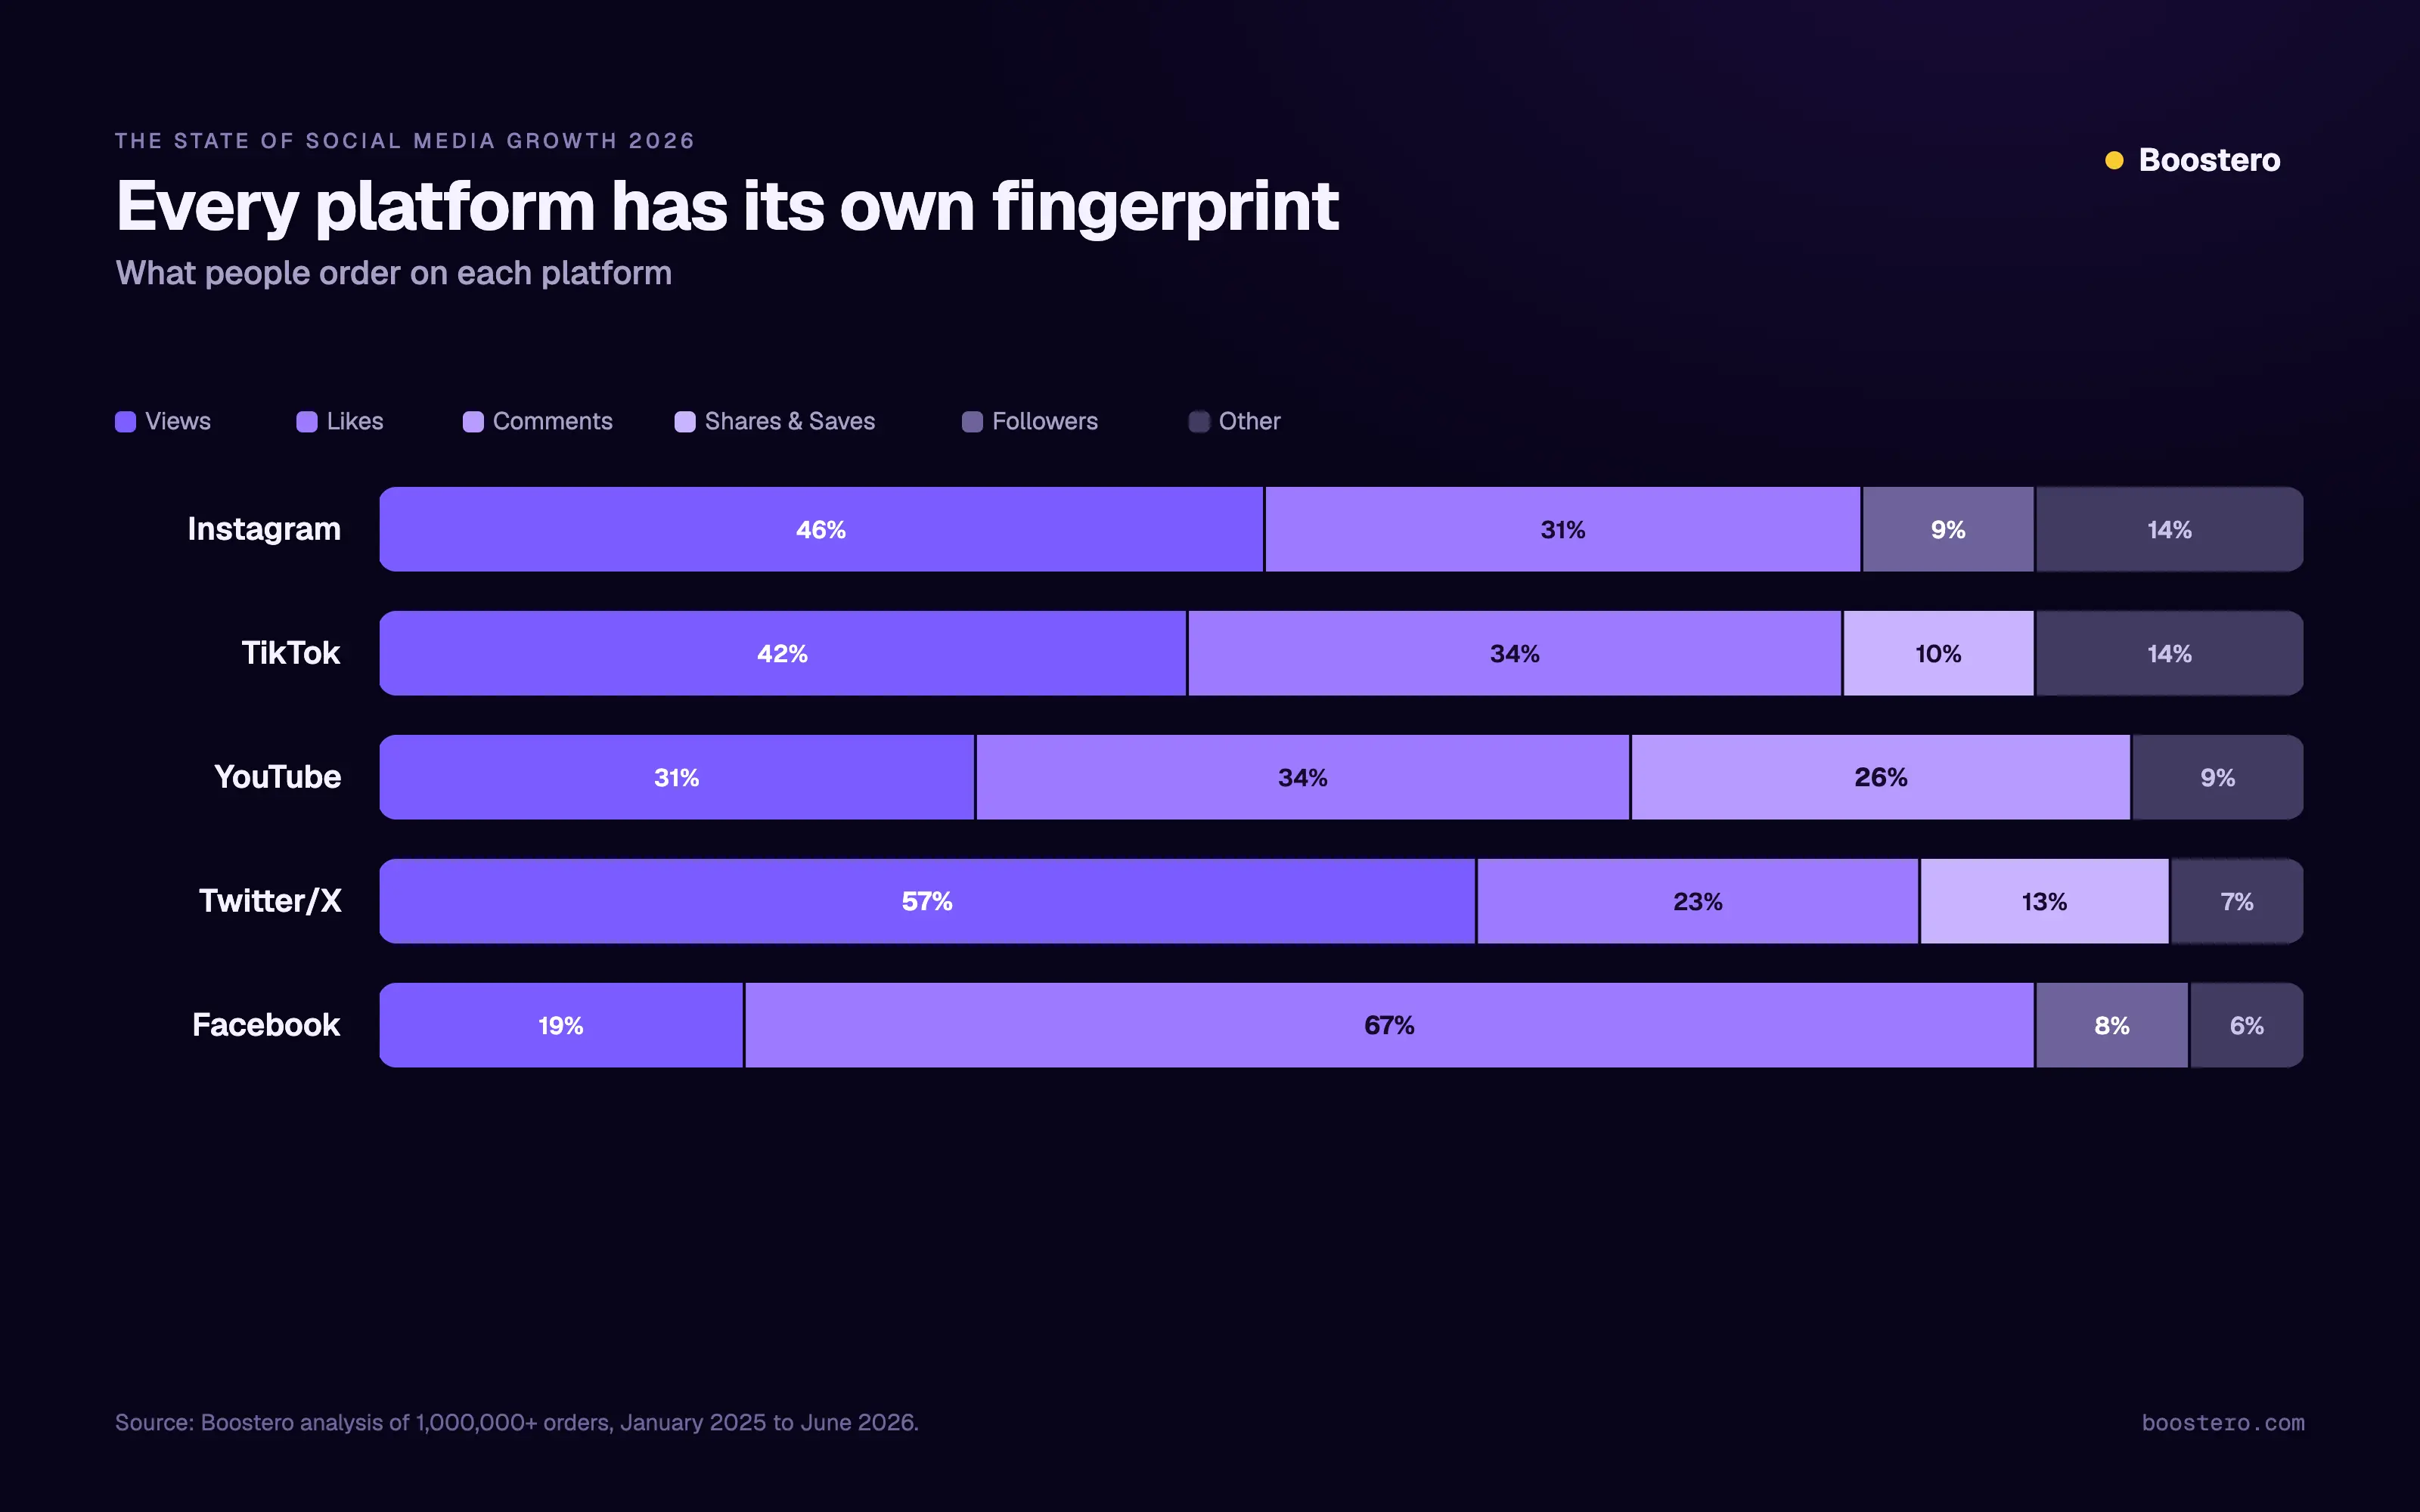
Service mix within each platform over 18 months. Instagram splits 46 percent Views to 31 percent Likes, and TikTok 42 to 34.
Demand is far from uniform. What people order looks different on every network:
- Facebook: two out of three orders are Likes (67 percent).
- Twitter/X: dominated by Views (57 percent).
- YouTube: stands out for Comments, which make up roughly a quarter of its orders (26 percent).
- Instagram and TikTok: both center on Views and Likes, reflecting their short-form-video core.
For creators and marketers, the takeaway is practical: a growth strategy that works on TikTok will not map cleanly onto Facebook or YouTube. Our customers order a different mix on each of these platforms, so match the service to the network rather than copying one plan everywhere.
Where the Orders Come From
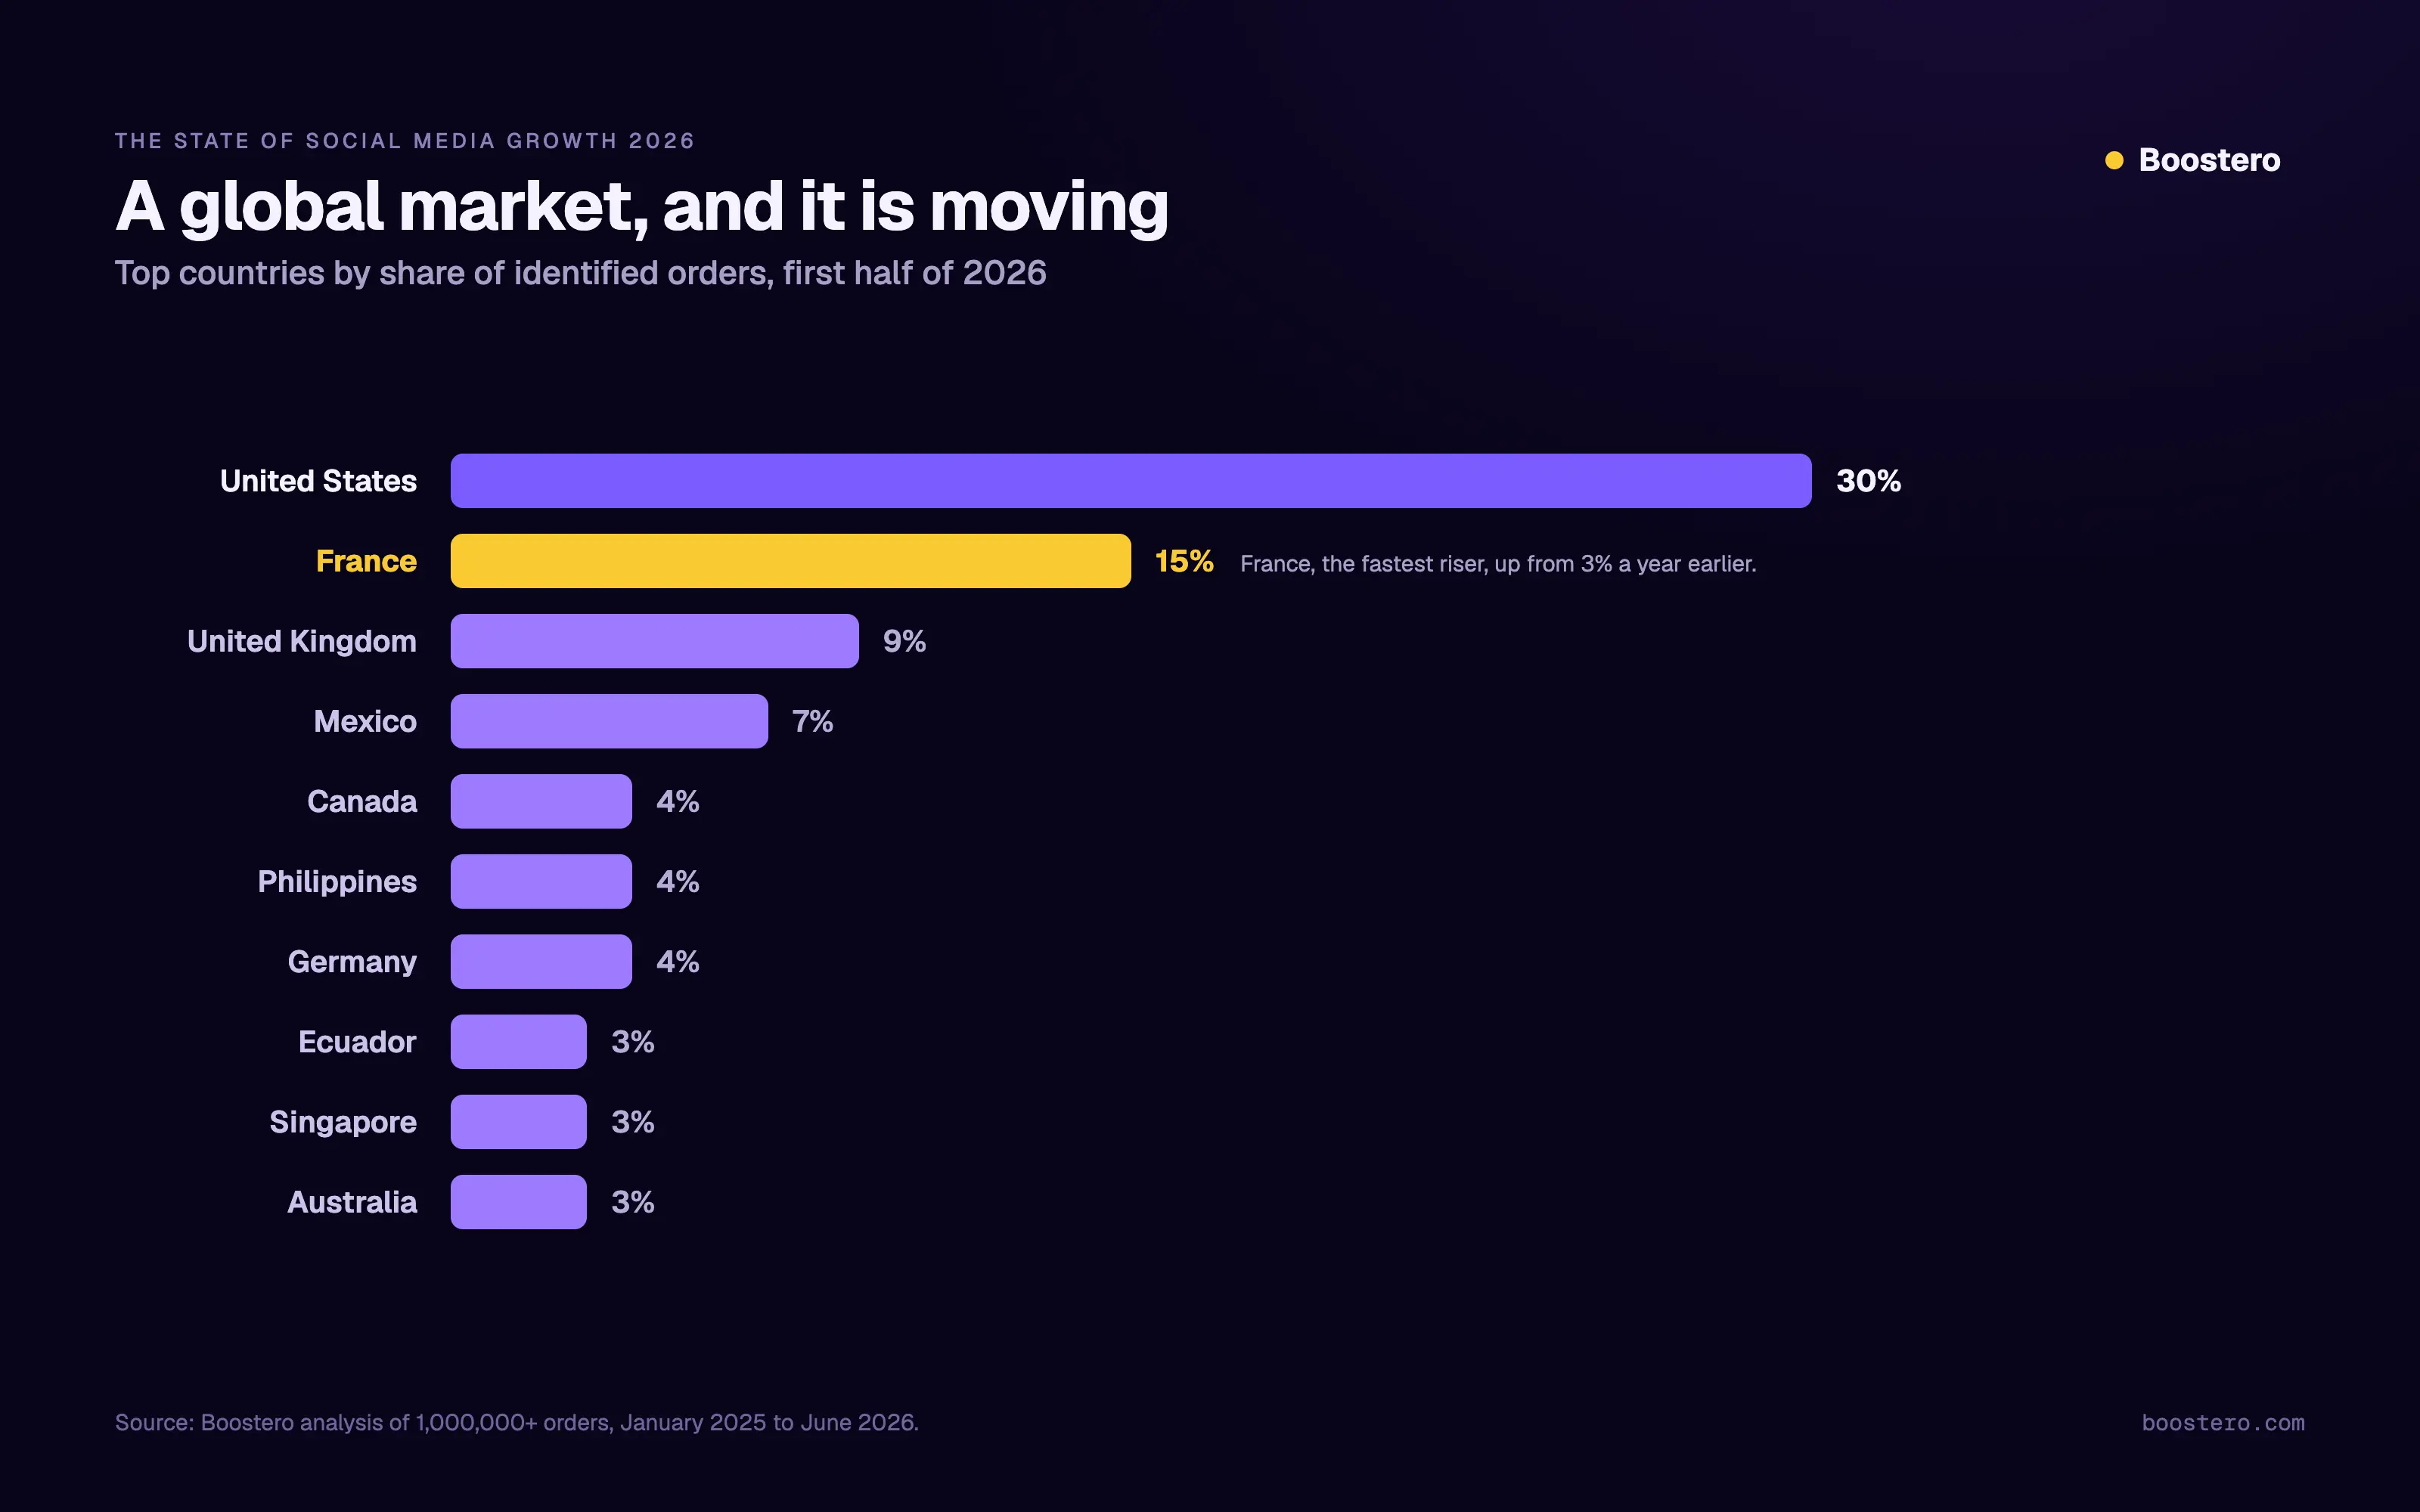
Top countries by share of identified orders, first half of 2026. The United Kingdom follows at 9 percent and Mexico at 7, with Canada, the Philippines and Germany each at 4.
Geographically identified orders in the study period came from more than 25 countries. The United States led at roughly 30 percent of geographically identified orders, but the standout mover was France, which climbed to about 15 percent in the first half of 2026, up from around 3 percent a year earlier, to become the second-largest market in the study.
Beyond the top two, demand was strong across Europe, Latin America, the Middle East and North Africa, and Asia-Pacific, with the United Kingdom, Mexico, Canada, the Philippines, Germany, Ecuador, Singapore, and Australia all featuring among the leading markets.
What This Means for 2026
Put the trends together and a strategy for the year ahead starts to take shape. Our customers have put a large share of their orders behind short-form video, and a growing share into engagement services such as shares, saves and comments.
If you are planning your own growth this year, three lessons stand out: prioritize the platforms where your audience already spends its attention, match the services you order to what you want a visitor to see on each platform rather than to raw follower counts, and remember that each network has its own rules. Boostero helps creators, brands, and resellers act on all three across 23+ platforms.
Our order data is not the only signal pointing this way. IAB and PwC put United States digital video ad revenue at 78 billion dollars for 2025, a rise of 25.4 percent in a year, against 13.9 percent growth for digital advertising overall. Source: IAB Internet Advertising Revenue Report, Full Year 2025.
Frequently Asked Questions
What data is this report based on?
The findings come from more than one million anonymized orders placed on Boostero between January 2025 and June 2026. All figures are aggregate shares, not individual data. Internal, test, and reseller accounts were excluded so the results reflect real end demand.
Which platform gained the most share of orders?
By share of orders, Instagram saw the largest gain, rising from 34 percent to 45 percent of all orders between the first halves of 2025 and 2026. TikTok also grew, from 26 percent to 31 percent. Together they account for roughly three-quarters of demand.
Why are Views and Likes ordered more than Followers?
The order data shows what customers bought, not why. Views and Likes change what a visitor sees on a post at a glance; what a platform then shows to more people is the platform's call. In this study, Followers made up just 9 percent of orders.
How was country data handled?
Country was derived from IP geolocation. The study dataset holds no IP addresses; only the country was kept. Boostero reports distributions and how they changed over time, not individual data.
Can I reference these findings?
Yes. You may reuse these figures with credit to Boostero and a link to this page (CC BY 4.0). If you need a specific cut of the data for an article, get in touch through our contact page.
Want to grow with the trends rather than against them? Create your account and explore our services across every major platform.