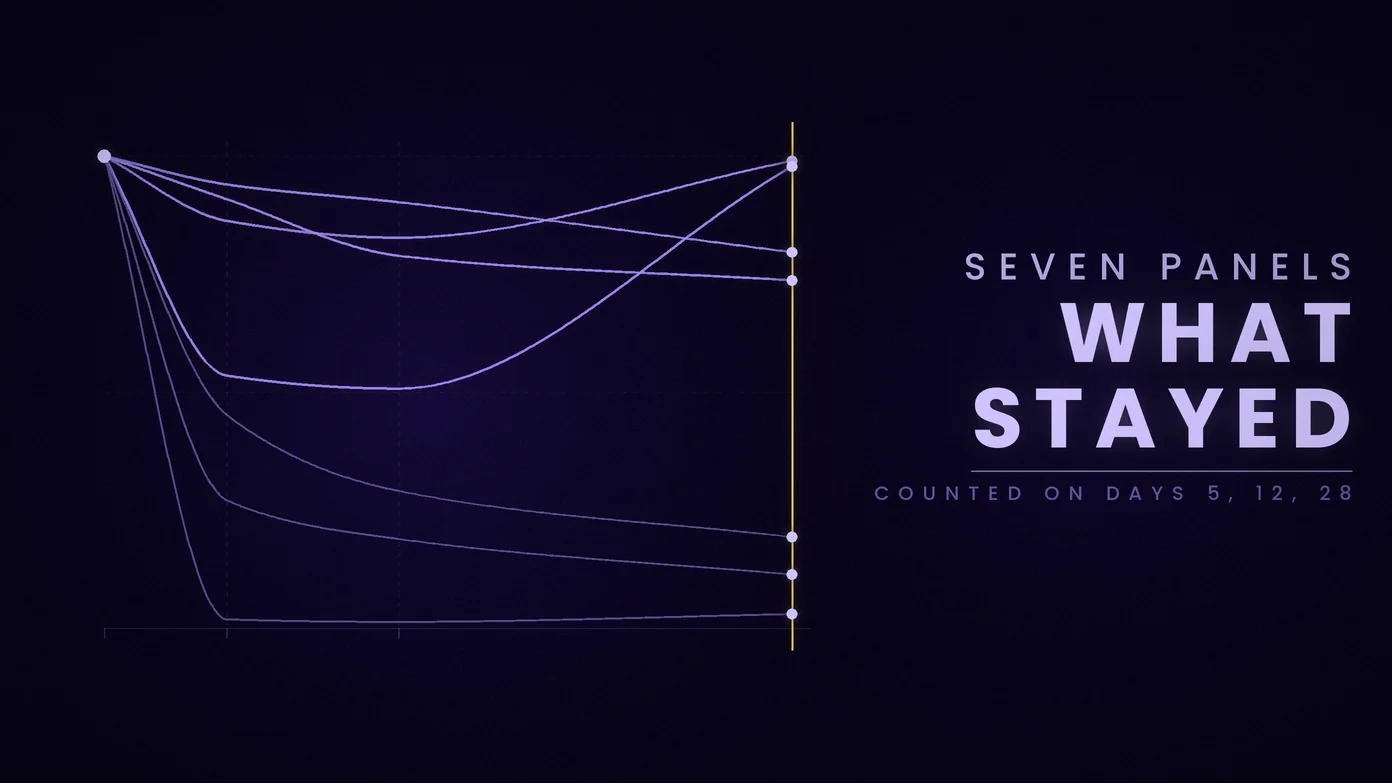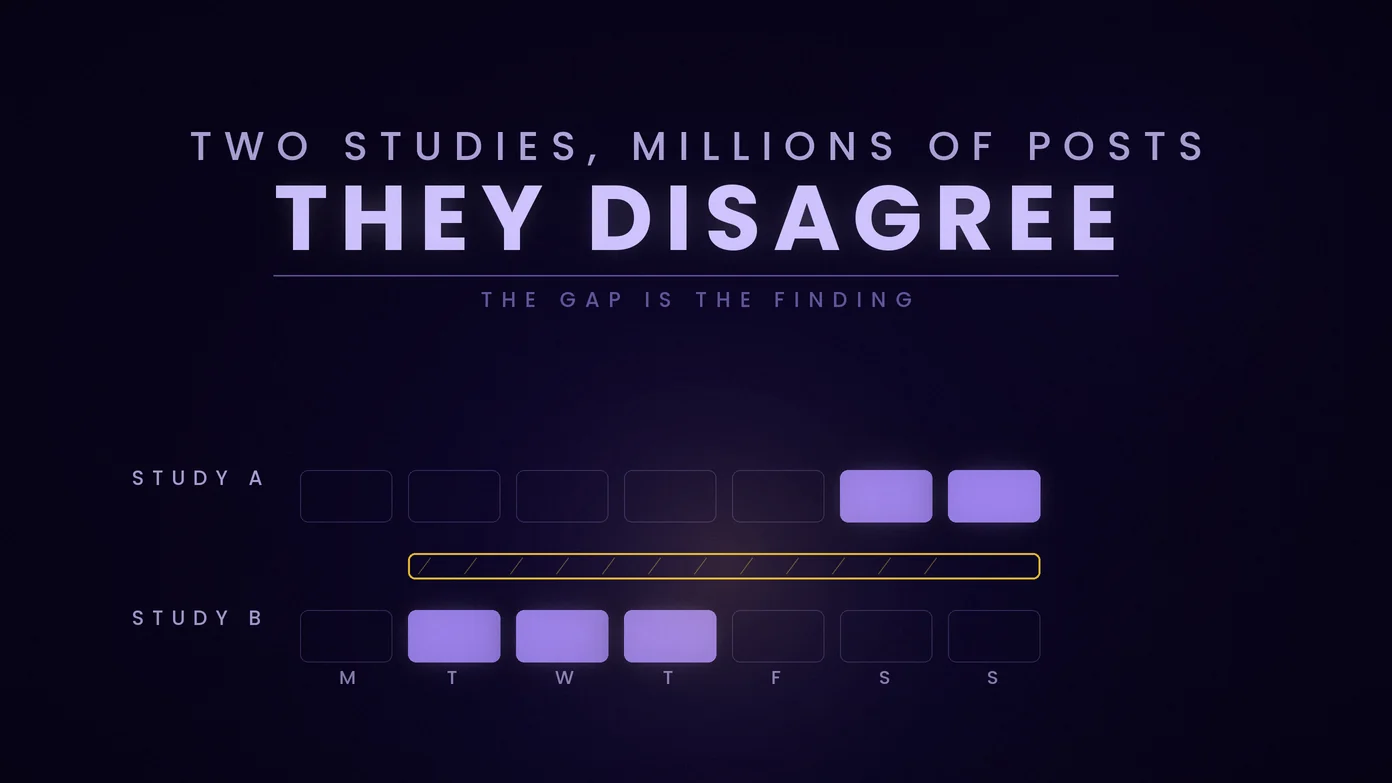
Most articles on this question pick a time and state it as fact. That is difficult to do honestly, because two large studies published in 2026 reach opposite conclusions, and both rest on samples too large to dismiss.
This guide sets out what each study found, why they disagree, and what to do about it. At the end there is a section on order timing from our own data, which answers a different question than the studies do and is labelled as such.
The Short Answer
There is no window the large studies share. Sprout Social's data peaks on weekday afternoons, 2pm to 6pm in your audience's local time; Buffer's peaks in the evening, 6pm to 11pm, and finds afternoons the weakest hours. Weekend mornings are contested too: Buffer rates them highest, Sprout Social advises skipping the weekend entirely.
The reason the answer is two windows rather than one time is the subject of the next section, and it is more useful than any single number on this page.
What the Studies Actually Found
Buffer analysed 7.1 million TikTok posts and ranked them by median engagement rate. It found Saturday the strongest day, with Sunday at 9am the single best slot, followed by Monday at 1pm and Sunday at 1pm.
Sprout Social analysed close to 2 billion engagements across roughly 307,000 profiles between November 2025 and February 2026. It found Tuesday through Thursday, 2pm to 6pm in the audience's local time, and advises skipping weekends.
Hootsuite analysed over a million posts and found a strong Saturday midday window, which leans toward Buffer.
SocialPilot analysed 700,000 posts and reports a dual-peak pattern across the day.
Read those again in order. Buffer says the weekend is the best time on TikTok. Sprout Social says avoid it. That is not a nuance between them, it is opposite advice, and both were measured on samples large enough that neither can be dismissed.
Why Two Correct Studies Disagree
Neither study is wrong. They measured different things, on different populations, over different periods, and each reported what it found.
- Different metric. Buffer ranks by median engagement rate per post. Sprout counts total engagements. The content with the highest rate is not the content that carries the largest total, and a weekend post to a small, attentive audience can win on one measure while losing on the other.
- Different population. Buffer measures posts scheduled through Buffer. Sprout measures its own customers' profiles, which skew toward brands and agencies. Brand accounts post on weekdays because people work on weekdays, and a dataset made of brand accounts will find weekday peaks partly because that is when the posts exist.
- Different window. Sprout's figures cover three winter months, late November to late February. Seasonal behaviour on a leisure platform is not constant across a year.
The disagreement is therefore information rather than noise. It tells you that TikTok timing depends heavily on who your audience is, which means an aggregate number is a starting point and not an answer.
How to Find Your Own Window
Your own analytics beat any published average, and the data is already in the app.
- Open TikTok Analytics and go to the Followers tab.
- Read Follower Activity, which shows the hours your followers are actually on the app. Note that it is displayed in UTC, so convert it to your own time before acting on it.
- Check top territories in the same tab. If your audience sits across several time zones, one posting time cannot serve all of them and you are choosing which group to serve.
- Post at one new time for two weeks, hold everything else steady, and compare. One variable at a time is the only way to read a result.
Two weeks is the shortest honest test. A single post that does well tells you about that post.
What Timing Can and Cannot Do
Timing affects who sees a video in its first hour, and the first hour affects whether the recommendation system tries it on a wider group. That is real, and it is why the question has an answer at all.
What timing cannot do is make a video worth watching. A post published at the perfect hour to an audience that scrolls past it has been shown to more people who did not stay, which is not an improvement. Retention is what the system is measuring, and posting time only decides who gets the chance to demonstrate it.
A Different Question: When People Order Engagement
This section is our own data, and it answers a neighbouring question rather than the one above. The studies measure when posts are published. We can measure when engagement is ordered, and what happens to those orders.
The figures below come from 280,000 TikTok orders placed between January 2025 and June 2026, after excluding four bulk accounts whose volume would otherwise carry the whole distribution. All times are UTC, because our order records do not carry buyer country, so they were not converted to local time. That limit is worth stating plainly: an evening peak in UTC across a global customer base is the sum of several local evenings, so it describes our order flow rather than any one country's habits.
Orders cluster in a six-hour block
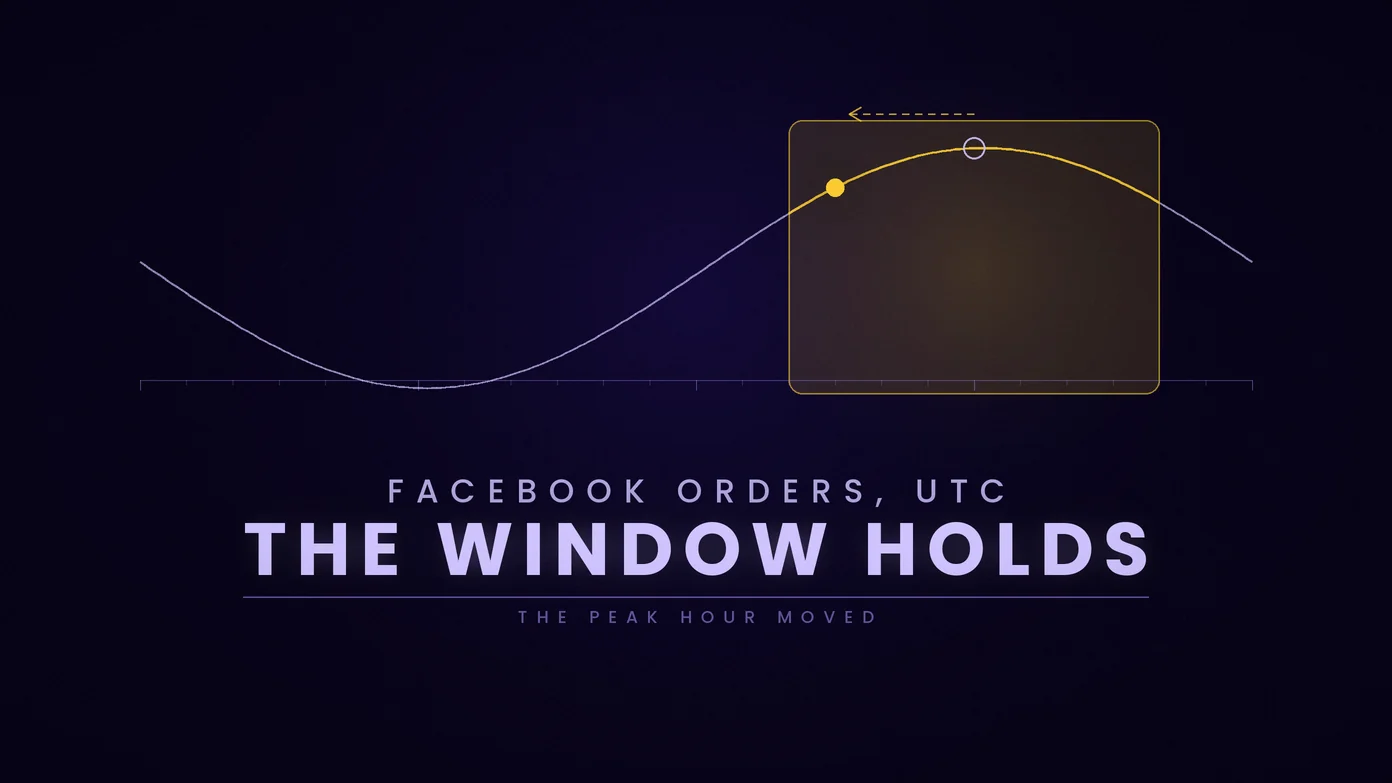
Counted by order, ordering runs 1.8 times higher at its daily peak, 19:00 UTC, than at its low point, 07:00 UTC, and the ratio between those two hours is at least that under every count we ran. The block from 15:00 to 21:00 UTC carries 31 percent of the day's orders in six of its twenty-four hours, and the hours from 14:00 UTC to midnight sit above the daily average whether we count every order, each account once, or leave out the largest accounts.
The single busiest hour is not fixed: counted by order it was 19:00 UTC in 2025 and 15:00 in the first half of 2026, and it moved earlier under every count we ran, by two to four hours. That is why the window is the finding and the hour is not.
By day of week the spread is narrower. The weekend takes 25.7 percent of orders against the 28.6 percent it would hold if the week were flat, and it stays below that share under every count we ran; which weekday is heaviest depends on how you count.
Counted by order, delivery outcome varies by hour
Counted by order, partial deliveries, meaning orders that could not be filled completely, were 2.5 times as common in the busiest hour (19:00) as in the quietest (07:00); counted by account, the difference was too small to be sure of. By day of week there is no measurable difference in partial deliveries under any count we ran.
So, counted by order, the hour matters and the weekday does not.
The caveat that makes this useful rather than a trick
The partial-delivery curve tracks order volume, not the clock. The hours with the most orders are the hours with the most partial deliveries, which points at load somewhere in the supply chain rather than at anything about the time of day itself. Part of the gap also comes from which services people order at busy hours: allowing for that mix, the ratio counted by order falls to 1.77 and can no longer be told apart from no difference, although the partial share still rises with order volume across the day.
Two things follow. First, the advice is real but self-limiting: ordering outside the peak block helps while that window stays quiet, and would stop helping if everyone moved. Second, the size of the effect is small in absolute terms. Counted by order, a 2.5 times ratio sounds dramatic, but the underlying difference is about one percentage point, which on a single order of a thousand followers is marginal. It is worth knowing if you place orders regularly, and not worth rearranging your day for if you do not.
What we cannot tell you
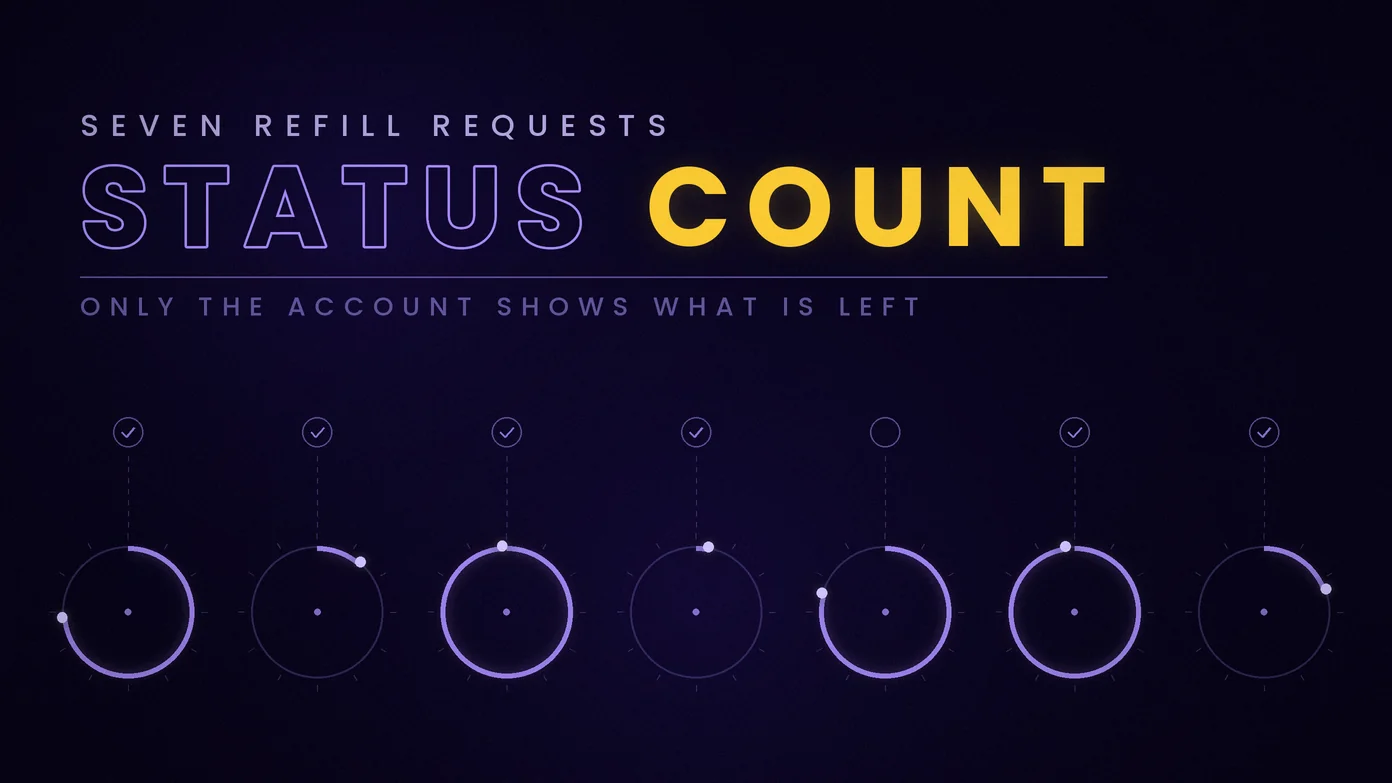
We have no retention figures by hour. Follower counts over time are not something we track, and the refill request data that would serve as a proxy does not exist as a queryable field. Rather than substitute a number from somewhere else, the honest position is that this measurement stops where the data stops.
Putting It Together
Start with two test slots rather than one: a weekday afternoon, 2pm to 6pm local, where Sprout Social's data peaks, and an evening after 6pm, where Buffer's does. Test the weekend deliberately rather than assuming either study applies to you, since that is precisely the point they contradict each other on.
Replace all of it with your own Follower Activity data as soon as you have two weeks of it, and remember to convert from UTC.
If you use a panel to give a post early momentum, our own numbers suggest ordering outside 15:00 to 21:00 UTC, with the caveat above attached. The TikTok panel covers views, likes, followers and shares, with paced delivery and public links only.
The wider version of the growth question, the part no schedule solves, is in our guide to seven principles that last.
Frequently Asked Questions
What is the single best time to post on TikTok?
There is not one, and any page giving a single time is reporting one study and omitting the others. Buffer's analysis of 7.1 million posts puts Sunday at 9am first; Sprout Social's analysis of nearly 2 billion engagements favours Tuesday to Thursday afternoons and advises skipping weekends. They do not share a window: Buffer finds evenings strongest and afternoons weakest, the reverse of Sprout's afternoon peak, so test one slot from each.
Why do the posting-time studies contradict each other?
They measure different things on different populations. One ranks by median engagement rate per post, the other counts total engagements. One samples posts scheduled through its own tool, the other samples its customers' profiles, which skew toward brands that post on weekdays. Neither is wrong; they answer slightly different questions.
Does posting time matter more than content on TikTok?
No. Timing decides who sees a video in its first hour, and the first hour affects whether the recommendation system tries it more widely. What happens after someone clicks is decided by the video. Timing buys a chance to be judged, not a better verdict.
How do I find the best time for my own account?
TikTok Analytics, Followers tab, Follower Activity. It shows when your followers are on the app and it is displayed in UTC, so convert before you act on it. Test one new posting time for two weeks with everything else held steady.
Is there a best time to buy TikTok engagement?
Counted by order, our data shows partial deliveries were 2.5 times as common in the busiest hour (19:00) as in the quietest (07:00); counted by account, the difference was too small to be sure of. Ordering outside 15:00 to 21:00 UTC carries slightly better odds of a clean fill, the effect tracks order volume rather than the clock, and the absolute difference is about one percentage point, so treat it as a small edge rather than a rule.
Should I post on weekends on TikTok?
Test it. This is the exact point Buffer and Sprout Social contradict each other on, which means the aggregate data cannot answer it for your account. Two weeks of weekend posting with your own analytics open will tell you more than either study.